
Learning Journal | Environmental Science
The question guiding this journal
How can changes in the tropical Pacific influence both marine food webs and weather thousands of kilometres away?
This journal uses Carbon Brief’s El Niño explainer as a starting point to examine the relationship between ocean circulation, atmospheric processes and ecological change (McSweeney and Dunne, 2026). My focus is on understanding the mechanisms behind these connections and considering how confidently their consequences can be predicted. Reading the explainer alongside NOAA resources and the IPCC assessment provides an opportunity to distinguish established physical processes from forecasts and remaining scientific uncertainty.
How do the ocean and atmosphere interact
El Niño is the warm phase of the El Niño–Southern Oscillation, or ENSO. The system also includes La Niña and neutral conditions. Describing ENSO as an ocean–atmosphere system matters because changes in winds influence the ocean, while changes in ocean temperature influence atmospheric circulation (NOAA, n.d.a; n.d.d).
Under neutral conditions, easterly trade winds move warm surface water towards the western tropical Pacific. The eastern Pacific remains comparatively cool, partly because colder water rises from below. The thermocline, the layer in which temperature changes rapidly with depth, is generally deeper in the west and shallower in the east. This configuration helps colder, nutrient-rich water reach the surface in the eastern Pacific (NOAA, n.d.a).
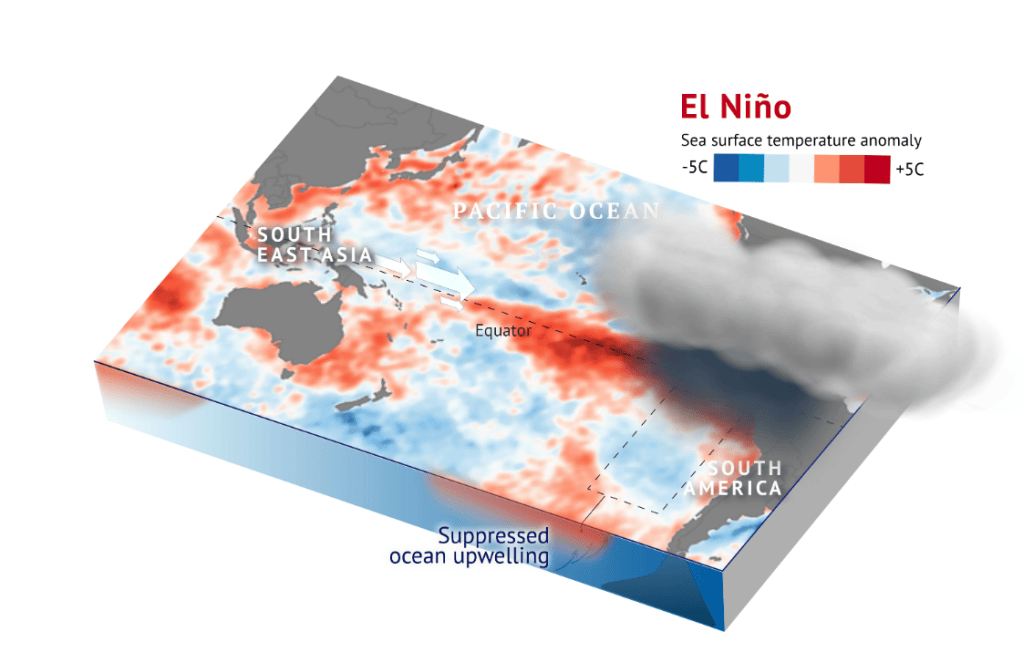
During El Niño, the trade winds weaken and warm water extends eastwards. The thermocline deepens in the eastern Pacific, reducing the supply of cold water to the surface. Rainfall patterns shift as the distribution of warm surface water changes (NOAA, n.d.a).
A question to consider: If winds affect ocean temperature and ocean temperature affects winds, where does the cause end and the response begin?
This question draws attention to feedback. Carbon Brief describes how a reduced east–west temperature contrast can further weaken the trade winds, reinforcing the initial change (McSweeney and Dunne, 2026). A useful interpretation is that ENSO develops through interacting processes rather than a single, isolated cause.
What changes during La Niña
La Niña is the cool phase of ENSO, characterised by unusually cool surface waters in the central and eastern equatorial Pacific. The easterly trade winds strengthen, pushing more warm surface water westwards and enhancing cold-water upwelling in the east (NOAA, 2026).
The thermocline becomes more steeply tilted, with a shallower thermocline in the eastern Pacific. This helps colder water from below reach the surface. In the west, warm water and rising moist air favour cloud formation and rainfall. The stronger east–west temperature contrast reinforces the Walker circulation, the broad atmospheric circulation linking rising air in the western tropical Pacific with descending air farther east (Bureau of Meteorology, n.d.a; 2012).
How does comparing La Niña with El Niño help explain the importance of wind?
The comparison shows that surface temperature depends partly on the movement of water. Wind alters where warm water accumulates and how readily colder water reaches the surface. This helps me connect atmospheric processes with the ocean’s vertical structure, rather than consider the ocean as a uniformly warming or cooling body.
Does La Niña always benefit marine ecosystems
The increased delivery of nutrient-rich water can support marine productivity in eastern Pacific upwelling regions (NOAA, 2026). However, this does not establish that all species or habitats benefit equally.
Would greater nutrient availability necessarily produce larger fish populations?
This is a hypothesis to investigate rather than an outcome to assume. I would want to examine phytoplankton growth, food-web relationships, species’ temperature requirements and fishing pressure. Population responses may also occur after a delay, making a single season an inadequate basis for judging ecological effects.
The term “cool phase” also needs geographical context. La Niña does not mean that every ocean region becomes colder. The Bureau of Meteorology explains that La Niña can strengthen the Leeuwin Current and increase marine heatwave risk off Western Australia (Bureau of Meteorology, n.d.c). This provides a useful counterexample to the assumption that a cool ENSO phase has uniformly cooling effects.
How does La Niña influence rainfall
La Niña tends to favour wetter conditions in eastern and central Australia, particularly during the Southern Hemisphere winter and spring. The northern wet season may also begin earlier (Bureau of Meteorology, n.d.a). These tendencies can increase flood risk, but the outcome depends on the particular event and other climate influences.
For example, the Bureau of Meteorology describes how La Niña and a negative Indian Ocean Dipole acted together in 2010, contributing to heavy rainfall and widespread flooding in eastern Australia (Bureau of Meteorology, n.d.b).
Why should I avoid describing La Niña as a perfect mirror image of El Niño?
Although the two phases involve broadly opposing Pacific temperature and wind anomalies, this does not imply equal and opposite consequences everywhere. The Bureau of Meteorology emphasises that no two events or sets of impacts are identical (Bureau of Meteorology, n.d.a). A useful next step would be to compare rainfall records across several events and ask which relationships are consistent and which vary.
Reading the diagrams
These original diagrams show simplified west-to-east sections across the equatorial Pacific. Indonesia and northern Australia are on the left; South America is on the right. The dashed line represents the thermocline. Orange indicates relatively warm water and blue indicates cooler water; the colours are illustrative, not measured temperature anomalies. Arrow thickness distinguishes typical wind and upwelling strength. The ocean surface is drawn level for clarity, and neither distance nor depth is to scale.
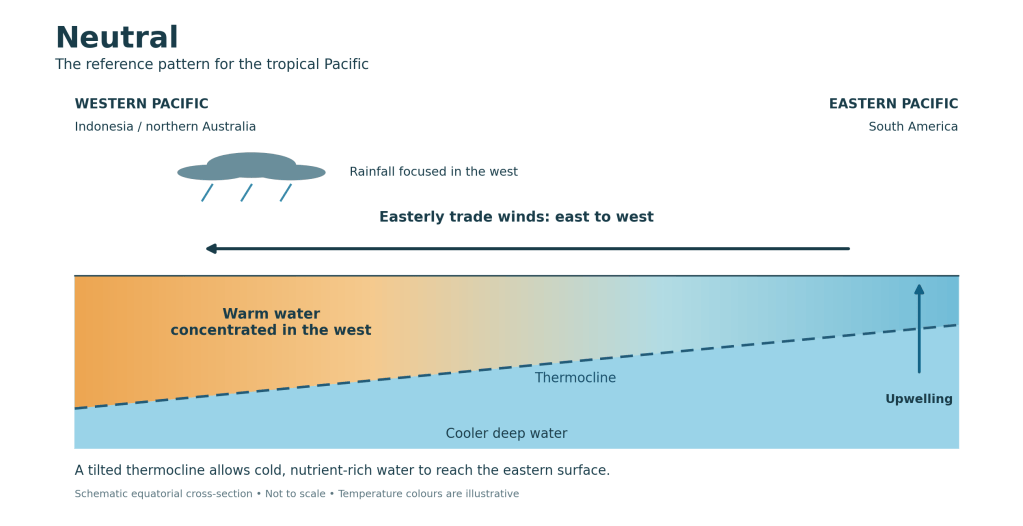
Figure 1. Neutral conditions provide the reference for comparing the two ENSO phases. Based on NOAA (n.d.a).
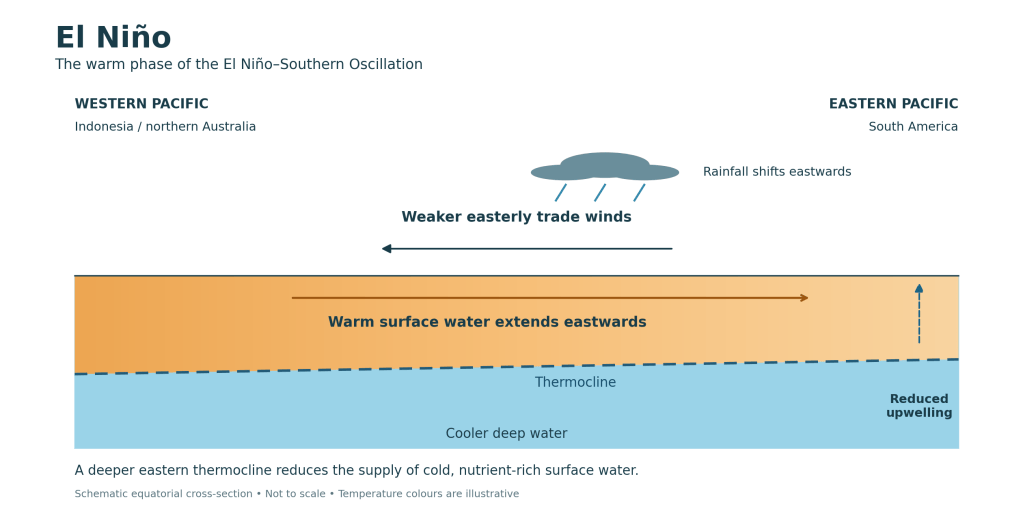
Figure 2. During El Niño, warm water and associated rainfall extend eastwards. Trade winds can sometimes reverse locally; the diagram shows the common weakened-easterly pattern. Based on NOAA (n.d.a).
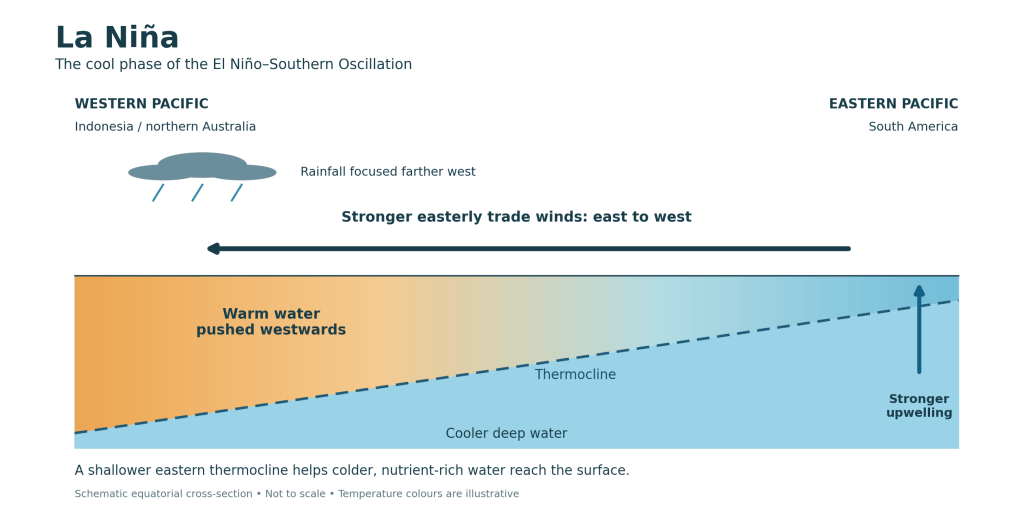
Figure 3. During La Niña, the strengthened Pacific temperature contrast is associated with stronger winds and a westward concentration of rainfall. Based on NOAA (n.d.a) and Bureau of Meteorology (2012).
Why does reduced upwelling matter for marine life
Upwelling connects physical oceanography with ecology. Water rising from depth supplies nutrients to the sunlit surface, where phytoplankton can use them for growth. These organisms form the base of many marine food webs, supporting consumers at successive trophic levels (NOAA, n.d.b).
During El Niño, a deeper eastern Pacific thermocline can reduce the effectiveness of upwelling in delivering nutrient-rich water to the sunlit layer. NOAA describes how this reduced supply can lower primary productivity and affect organisms higher in the food web, including commercially important fish (NOAA, n.d.c).
Does warmer water necessarily mean greater biological productivity?
This example shows why temperature alone is insufficient to explain productivity. Light may remain available, yet phytoplankton growth can be constrained by nutrient supply. To interpret an ecological response, I therefore need to consider the conditions that enable growth, rather than assume that a warmer environment will support more life.
A related research question is whether biological responses occur immediately or after a delay. Comparing temperature, nutrient concentrations, phytoplankton abundance and fish populations over time could help distinguish the sequence of changes. Such an investigation would also need to consider fishing pressure and other influences before attributing population changes to ENSO.
How can a Pacific event influence distant weather
The warmest tropical waters help determine where moist air rises and rainfall develops. During El Niño, the eastward movement of this region changes atmospheric heating and circulation. These changes can influence weather well beyond the tropical Pacific through distant climatic connections, commonly termed teleconnections (NOAA, n.d.c).
For example, NOAA describes how El Niño can shift the Pacific jet stream southwards and extend it eastwards. This favours wetter winter conditions in the southern United States, while northern areas can experience warmer and drier conditions (NOAA, 2026).
Does a recognised climatic relationship mean that every event produces the same local outcome?
A careful interpretation is that ENSO changes the likelihood of particular conditions. A regional tendency should not be read as a guarantee for an individual place or season. For my own interpretation of environmental information, this is a distinction between identifying an increased risk and predicting an inevitable outcome.
To assess local impacts, I would want to compare several events, examine seasonal differences and consider other climatic influences. A single example may illustrate a mechanism, but it cannot establish the full range of possible responses.
What should I ask about a super El Niño forecast
Carbon Brief’s discussion of a possible exceptionally strong 2026–27 event raises questions about how scientific forecasts are communicated. The article notes that “super El Niño” is not a recognised scientific term (McSweeney and Dunne, 2026).
The label therefore requires examination. What variable defines strength? Which reference period establishes the temperature anomaly? Does a large ocean-temperature anomaly necessarily imply the greatest ecological or social damage in every region?
An academic reading should also distinguish observations from projections. A forecast describes a possible future outcome conditional on evidence and modelling assumptions; it is not a measurement of an event that has already reached its peak. Forecasts should be identified by their issue date and revisited as observations become available.
These questions matter because an emphatic headline can conceal differences between confidence in the broad physical mechanism and confidence in a specific regional consequence.
How does ENSO relate to climate change
El Niño can temporarily increase global surface temperature, while La Niña can exert a cooling influence. These fluctuations occur alongside the longer-term warming driven by human activities; they do not provide an alternative explanation for that trend (McSweeney and Dunne, 2026).
The relationship between warming and ENSO itself requires more careful wording. The IPCC’s 2021 assessment found no model consensus on a systematic change in ENSO sea-surface-temperature variability during this century. However, it assessed that ENSO-related rainfall variability would very likely increase during the latter half of the century under the intermediate, high and very high emissions scenarios SSP2-4.5, SSP3-7.0 and SSP5-8.5 (IPCC, 2021).
Could the consequences of ENSO intensify even without a clear increase in its ocean-temperature variability?
The assessment indicates that they could. This is a useful distinction between changes in a climate pattern and changes in its effects. It also demonstrates why uncertainty about one aspect of a system does not imply equal uncertainty about every related process.
Reflection and further enquiry
The central lesson I take from this topic is that ecological change must be understood within its physical context. A change in atmospheric circulation can alter ocean conditions, affect nutrient supply and influence the food available to marine organisms. Understanding these relationships requires following the mechanisms linking different parts of the system.
This also develops my approach to evidence. I need to distinguish a physical explanation, an observed association and a forecast. Each supports a different kind of conclusion.
My next enquiry would ask: How closely do changes in eastern Pacific phytoplankton productivity follow changes in thermocline depth during El Niño and La Niña? Comparing several events would allow me to investigate both the proposed relationship and its variability. I would begin by identifying suitable time series and considering their spatial coverage, measurement limitations and the possibility of delayed biological responses.
References
McSweeney, R. and Dunne, D. (2026) Explainer: How the ‘super El Niño’ will reshape the world’s weather. Carbon Brief, 18 August. Available at: https://interactive.carbonbrief.org/el-nino-explainer/index.html (Accessed: 12 October 2026).
NOAA (n.d.a) Effects of ENSO in the Pacific. Available at: https://www.noaa.gov/jetstream/tropical/enso/enso-patterns (Accessed: 12 October 2026).
NOAA (n.d.b) What is upwelling? Ocean Exploration. Available at: https://oceanexplorer.noaa.gov/ocean-fact/upwelling/ (Accessed: 12 October 2026).
NOAA (n.d.c) What is El Niño? Pacific Marine Environmental Laboratory. Available at: https://pmel.noaa.gov/elnino/what-is-el-nino/ (Accessed: 12 October 2026).
NOAA (2026) What are El Niño and La Niña? National Ocean Service. Available at: https://oceanservice.noaa.gov/facts/ninonina.html (Accessed: 12 October 2026).
IPCC (2021) Climate Change 2021: The Physical Science Basis. Working Group I contribution to the Sixth Assessment Report, Technical Summary and Summary for Policymakers, section B.3.2. Available at: https://www.ipcc.ch/report/ar6/wg1/downloads/report/IPCC_AR6_WGI_SummaryVolume.pdf and https://www.ipcc.ch/report/ar6/wg1/chapter/summary-for-policymakers/ (Accessed: 12 October 2026).
Bureau of Meteorology (n.d.a) El Niño and La Niña. Available at: https://www.bom.gov.au/resources/learn-and-explore/climate-knowledge-centre/climate-factors/el-nino-and-la-nina (Accessed: 12 October 2026).
Bureau of Meteorology (n.d.b) What is La Niña and how does it impact Australia? Available at: https://www.bom.gov.au/climate/updates/articles/a020.shtml (Accessed: 12 October 2026).
Bureau of Meteorology (n.d.c) La Niña and marine heatwaves off Western Australia. Available at: https://media.bom.gov.au/social/blog/2555/la-nia-and-marine-heatwaves-off-western-australia/ (Accessed: 12 October 2026).
Bureau of Meteorology (2012) Record-breaking La Niña events: An analysis of the La Niña life cycle and the impacts and significance of the 2010–11 and 2011–12 La Niña events in Australia. Available at: https://www.bom.gov.au/climate/enso/history/La-Nina-2010-12.pdf (Accessed: 12 October 2026).

